Age-friendly housing: Meeting the needs of Ireland’s ageing population
3rd July 2024
SSE AES: Making Irish homes cosier and more energy efficient
3rd July 2024Social housing disparity across local authorities

The number of households in the state in the state whose social housing need is not being met rose by almost 1,000 between 2022 to 2023, with an evident disparity of need across all 31 local authorities.
On 1 November 2023, a total of 58,824 households were recorded as qualified for social housing support but were not having their social housing needs met.
While the figure is an overall decrease of some 36 per cent from an initial assessment in 2016, the 2023 assessment represents an increase of 982 over the year, with only nine of the 31 local authorities recording a decrease in households waiting.
The figures do not include those who are deemed to have had their housing need met through social housing supports such as the Housing Assistance Payment (HAP), the Rental Accommodation Scheme (RAS), or the Social Housing Capital Expenditure Programme.
The figures are represented in The Housing Agency’s Summary of Social Housing Assessments (SSHA) report, which offers a snapshot at a point in time of the housing lists of 31 local authorities.
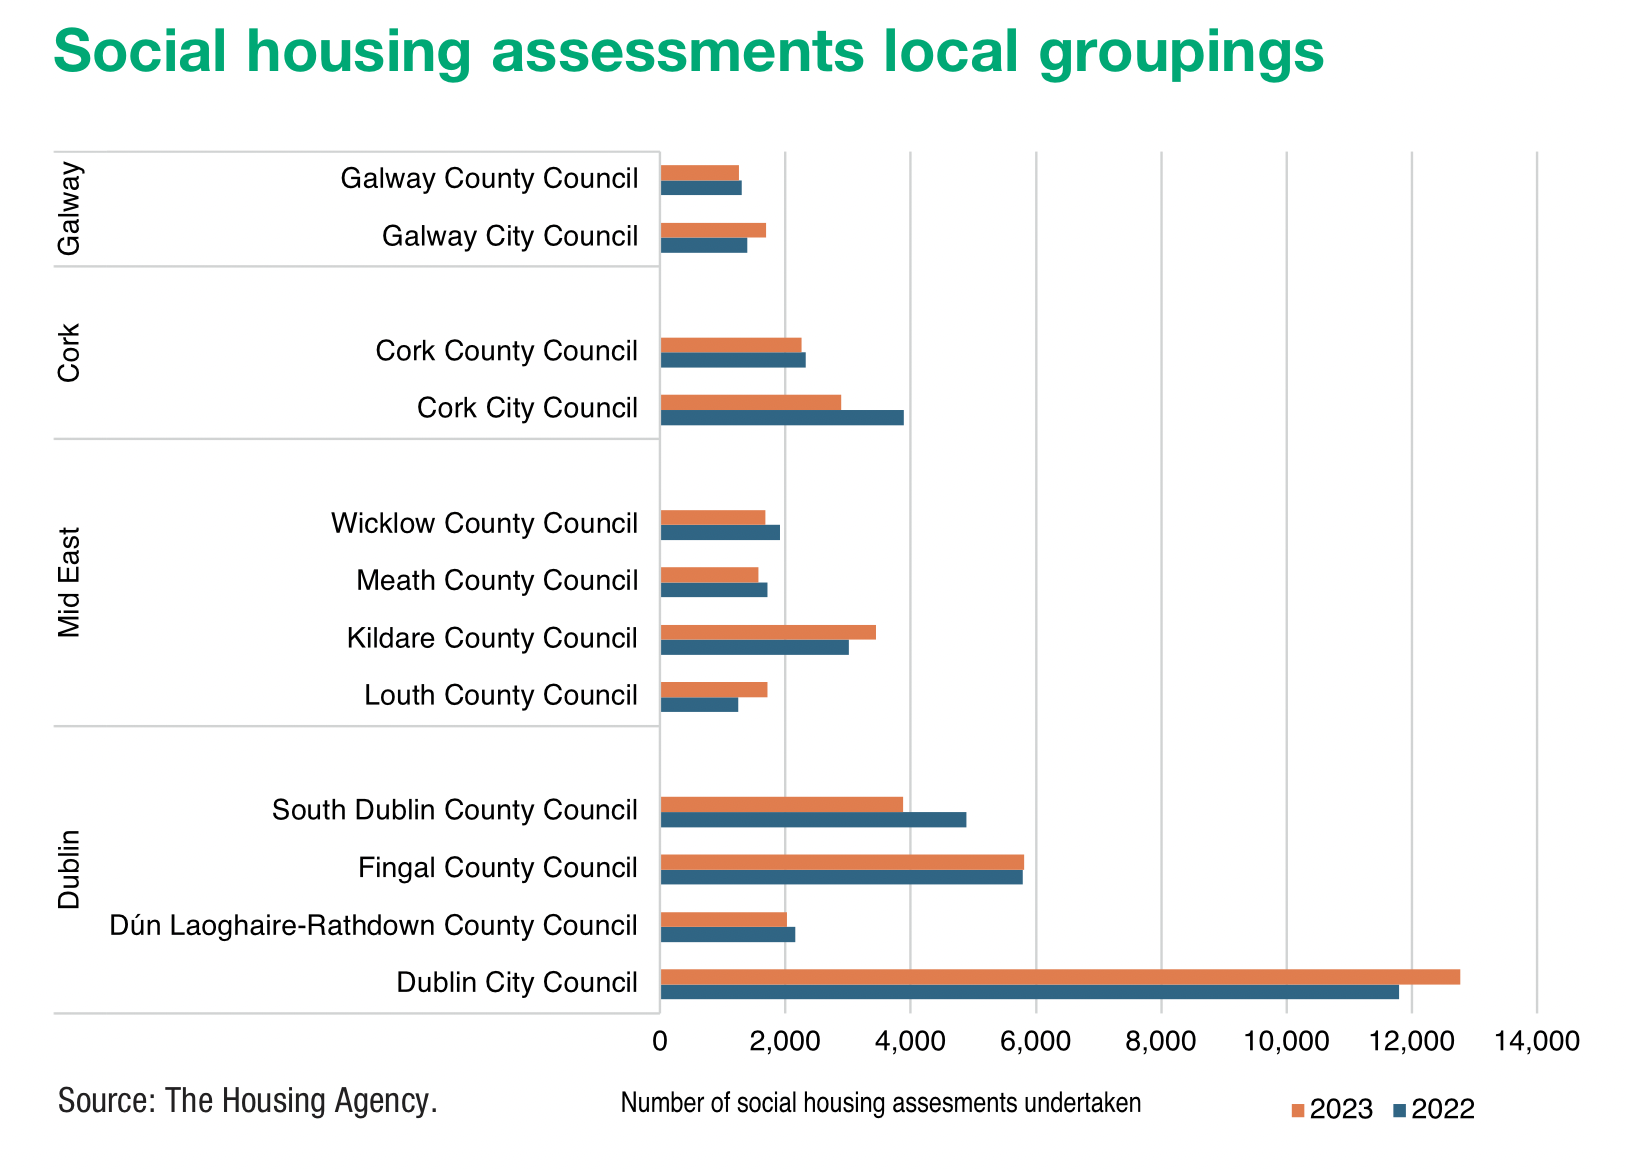
The four Dublin local authorities account for almost 42 per cent of the national total of applicants qualifying for social housing support, with a combined 12,779 households on the waiting list, and recorded a decrease of 142 households (0.6 per cent) over the year.
Cork City Council registered the largest reduction of its waiting list, reducing the list by 993 (25.6 per cent) households from 3,886 to 2,893. South Dublin County Council and Longford County Council also recorded annual percentage decreases above 20 per cent, however, this is in the context of large disparities in the size of the waiting lists for each local authority.
For example, Leitrim County Council had 198 households who qualify for social housing support but who are not having their needs met in 2023, the lowest of all 31 local authorities. compared to Dublin City Council, who recorded the highest rate of 12,779.
Household profile
The report also measures changes to household profiles within the local authorities. While many of the overarching themes of household profiles remain the same, there have been some notable shifts in respect of the waiting list.
For example, one-adult households continue to be the main household grouping on the waiting list, rising from 56 per cent in 2022 to 57.4 per cent in 2023. While one-parent family households continue to be the highest household grouping, that number has fallen marginally from 23.5 per cent to 23.3 per cent over the year.
Similarly, decreases were recorded in the number of people within the private rented sector (with and without rent supplement) on the waiting list, a trend which has been consistent since 2016. Currently, 40 per cent of the waiting list is occupied by those within the private rented sector, down from 67.4 per cent when an initial assessment of all local authorities was carried out.
A decrease was also recorded in the second largest tenure type on the waiting list, households living with parents, relatives, and friends over the year, down from 37 per cent to 34.5 per cent in 2023.
However, these decreases are in the context of annual increase – from 11.6 per cent to 13.5 per cent – of the number and proportion of households whose basis of need for social housing is homelessness.
Income
Also telling is the fact that the number of applicants deemed ‘unemployed and in receipt of social welfare’ has been declining year-on-year since 2016. Just under half (49.4 per cent) of all those on the waiting list fall into this category, however, in contrast, those households where the main applicant is deemed employed has risen by 2.7 per cent from 2022 to 2023. There was also a marginal increase in the number of households on the waiting list whose employment status is ‘retired’ (0.7 per cent).