Housing: Ireland’s greatest domestic policy challenge
1st August 2018
Public housing is the solution
1st August 2018House prices remain strong

According to the Central Statistics Office (CSO), residential property prices at national level increased by 13.0 per cent in the year to April 2018. This compares with an increase of 12.6 per cent in the year to March and an increase of 9.5 per cent in the 12 months to April 2017.
In Dublin, residential property prices increased by 12.5 per cent in the year to April. Dublin house prices increased 11.7 per cent. Apartments in Dublin increased 15.9 per cent in the same period. The highest house price growth was in Dublin City, at 14.9 per cent.
In contrast, the lowest growth was in South Dublin, where house prices increased 6.9 per cent.
Residential property prices in the Rest of Ireland (i.e. excluding Dublin) were 13.6 per cent higher in the year to April. House prices in the Rest of Ireland increased 12.9 per cent over the period. The Mid-West region showed the greatest price growth, with house prices increasing 18.7 per cent. The Border region showed the least price growth, with house prices increasing 9.3 per cent. Apartment prices in the Rest of Ireland increased 17.8 per cent in the same period.
Overall, the national index is 21.1 per cent lower than its highest level in 2007. Dublin residential property prices are 23.3 per cent lower than their February 2007 peak, while residential property prices in the Rest of Ireland are 26.1 per cent lower than their May 2007 peak.
From the trough in early 2013, prices nationally have increased by 76.0 per cent. Dublin residential property prices have increased 90.1 per cent from their February 2012 low, whilst residential property prices in the Rest of Ireland are 69.9 per cent higher than the trough, which was in May 2013.
Meanwhile, estate agents Sherry FitzGerald are confirming that the average value of Irish established homes rose by 1.2 per cent in the second quarter of 2018, bringing growth in the year to date to 3.2 per cent. This compares to growth of 4.4 per cent recorded in the opening six months of 2017.
There was also a notable moderation in the pace of price inflation in Dublin, with average values increasing by 1.0 per cent during the second quarter of 2018. Prices in Dublin have grown by 3.3 per cent in the year to date, notably lower than the 4.7 per cent growth in the same period in 2017.
When Dublin is excluded from the national figure, the quarterly increase is 1.4 per cent. In the year to date, house prices for the rest of Ireland increased by 3.1 per cent, compared to growth of 4.1 per cent recorded in the same period in 2017.
In the regional centres outside of Dublin, Galway recorded the highest increase of 4.8 per cent during the opening half of 2018, while prices in Limerick and Cork increased by 1.6 per cent and 1.4 per cent, respectively.
Marian Finnegan, Chief Economist at Sherry FitzGerald says: “After a strong opening quarter, there was a significant moderation in the pace of price inflation, most notably in Dublin and the regional centres of Limerick and Cork. The combination of an increase in the delivery of new homes in Dublin and the tightening of Macro-prudential policy on mortgage lending both appear to have led to this slowdown in price inflation.”
The Property Price Register reveals that approximately 11,447 transactions were recorded during the first quarter of 2018 with a total value of €3.1 billion. Due to the time lag in logging data to the Property Price Register, quarter one data is the most accurate data available. If one excludes multi-family/portfolio sales, the figure declines to approximately 10,900, of which 3,600 were in Dublin. On an annual basis, the volume of sales grew by 5 per cent nationally and 6 per cent in Dublin.
New dwelling completions
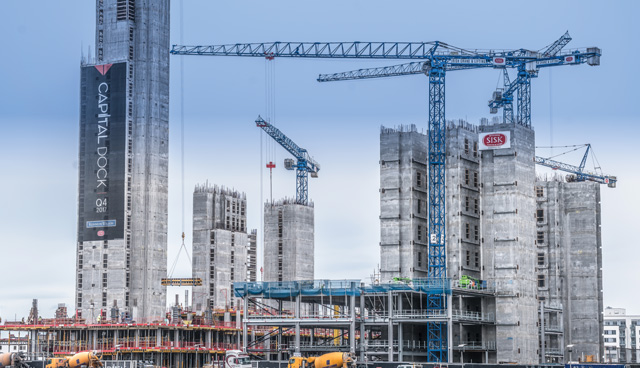
The CSO has also published new dwelling completions for the first quarter of 2018. This is the first of a quarterly series which includes data on new dwellings built in Ireland since 2011.
The report shows that the number of new dwellings built declined from 6,994 in 2011 to 4,575 in 2013. However, over the following four years the numbers of new dwellings built has increased steadily each year to stand at 14,446 in 2017, a year-on-year increase of 45.7 per cent. In the first quarter of 2018 there were 3,526 new dwellings built.
Commenting on the report, Kieran Culhane, senior statistician at the CSO, says: “There has been much debate around the reliability of data analysing the number of new dwelling completions in Ireland. The core problem has been that no single, authoritative data source exists.
“Those administrative data sets which are available are fragmented and tend to either over or under-represent actual new dwelling completions in any given time period, meaning that taken in isolation, none can provide an accurate count.
“For the first time, the best available housing related data sets have been combined and linked using innovative new data analysis techniques, to produce the most comprehensive and accurate count of new dwelling completions currently available. Some limitations remain, but the CSO has identified these and is working with key stakeholders to further refine and improve the accuracy of future analysis.”
He adds: “Prior to the publication of this report several datasets were available regarding new dwelling completions. The Department of Housing, Planning and Local Government used the ESB Networks domestic connections dataset to publish a proxy indicator for the number of new dwellings built.
“However, it is now accepted that this dataset overestimated housing output as it included connections which do not relate to new dwellings. Figures produced by others based on the Building Energy Rating data sets were acknowledged to underestimate the count.”
Under the auspices of the Statistics Act 1993, the CSO is in a unique position to gather and link fragmented administrative data sources and evaluate their potential for statistical use. To produce this report, the CSO linked data from ESB Network domestic connections, Building Energy Rating data sets, Revenue data sets, Geodirectory and Census of Population data. Further adjustments were required to take account of connections to the ESB Network of previously completed dwellings in unfinished/ghost estates.
Culhane continues: “Our analysis found that the ESB connections dataset remains the most comprehensive available for estimating new dwelling completions. However, the CSO’s New Dwelling Completions series for 2017 shows that the number of new dwellings was 4,825 below the number of ESB connections published by DHPLG. 57 per cent of the difference is accounted for by reconnections, 23 per cent by previously completed dwellings in unfinished housing developments and 20 per cent by non-dwelling connections.
“This breakdown will be published in the new quarterly release to facilitate analysis of housing becoming available for use.”
The CSO’s New Dwelling Completions data does not include a full range of activity in the housing sector. A significant level of construction output in the student accommodation sector in recent years is not included in this series.
“These are generally connected to the ESB network as commercial connections and are therefore not included in the ESB domestic connections data set. The data available on this sector is on a ‘bed space’ basis and it is not currently possible to report on it as dwellings, which are self-contained units of living accommodation. Based on consultation with stakeholders in this sector, student accommodation may be included in future new dwelling completions reports as a separate category,” concludes Culhane.


